
Automating Data Cleaning in Python: 5 Essential Steps
Automating this process in Python can significantly increase efficiency and consistency

Data cleaning is a crucial stage in any data science project, ensuring the accuracy and reliability of your analysis. However, manually cleaning data can be time-consuming and error-prone. Automating this process in Python can significantly increase efficiency and consistency. Here’s a guide to automating data cleaning, structured around five simple steps that address common data issues.
1. Identifying Data Format
Before any cleaning can begin, you must identify the format of your data. Data can come in various formats like JSON, CSV, or XML, each requiring a specific parser:
read_csv()for CSV filesread_json()for JSON files
Creating a function to detect the file extension and apply the appropriate parser simplifies the initial step of your cleaning process.
2. Removing Duplicates
Duplicate data can skew analysis results, making it critical to identify and remove any redundancies:
Use Pandas’
drop_duplicates()method to remove duplicate rows efficiently.
Ensuring your dataset is free from duplicates is a straightforward but vital step in pre-processing.
3. Handling Missing Values
Missing data is a common issue that can affect the outcome of your analysis. Depending on the nature of your data, you might:
Delete observations with missing values.
Fill gaps using forward fill, backward fill, or by substituting with the mean or median of the column.
Deciding on a strategy depends on the dataset and the specific requirements of your project.
4. Correcting Data Types
Incorrect data typing can lead to significant analysis errors:
Automate checks for data types to ensure each column is stored in the expected format.
Set up alerts for any mismatches to correct them promptly.
This step helps maintain the integrity of your numerical computations and categorical analyses.
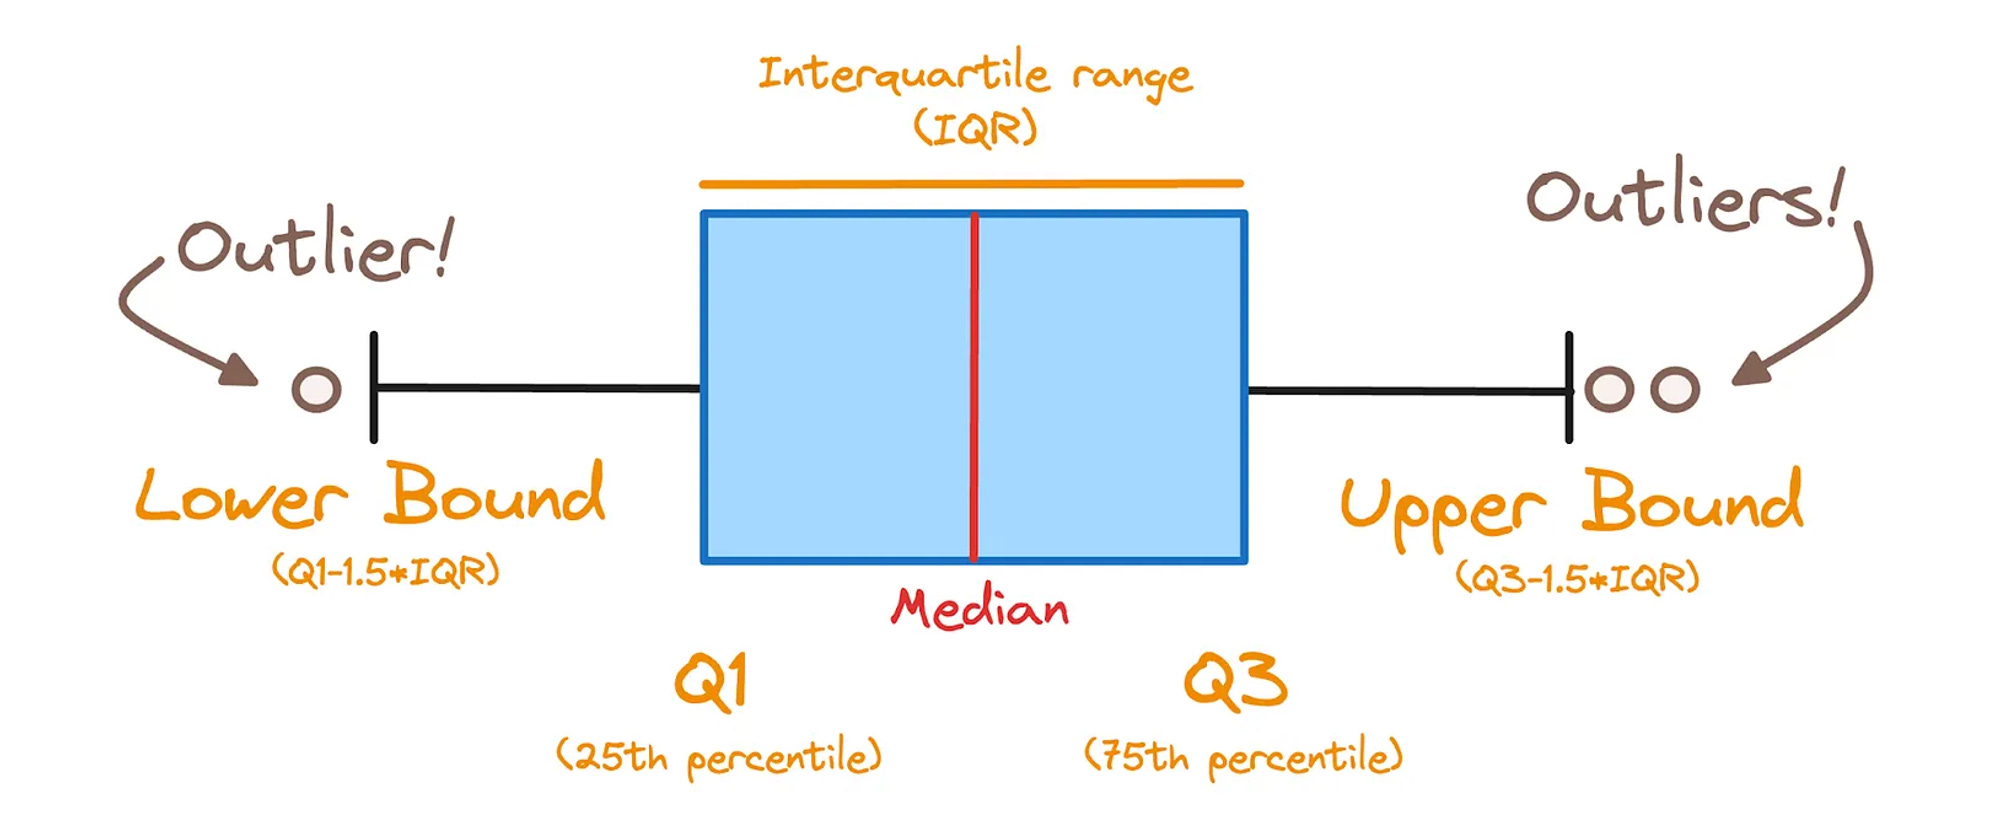
5. Managing Outliers
Outliers can disproportionately influence the results of your data analysis. Handling them effectively involves:
Setting thresholds and capping values.
Using statistical methods like the z-score to identify outliers.
Outliers are typically defined as any record outside the range of
where IQR is the interquartile range, and Q1 and Q3 are the first and third quartiles, respectively.
Conclusion
By automating these five steps in Python, you can streamline the data cleaning process, ensuring that your datasets are well-prepared for reliable analysis. Automation not only saves time but also enhances the consistency and accuracy of your data handling procedures.
🚀 Welcome to Data Dilemmas: A Journey Through Data and Discovery
Hello, I'm Tripathi Aditya Prakash, your navigator through the intricate world of data science, artificial intelligence, and machine learning, intertwined with the essence of life's ongoing lessons. As the person behind Data Dilemmas and a dedicated data analyst, I invite you to a unique blend of professional insights and personal reflections, all through the lens of a data enthusiast.
🌌 Embark on a Unique Expedition
Join us at Data Dilemmas where we explore not just the binary of data but also the spectrum of experiences it encompasses. Here's what you'll discover:
Data Dilemmas Exclusives: Access in-depth articles and narratives not found elsewhere, blending data with daily life.
Data-Driven Discoveries: Insights where data science meets the art of living.
Behind the Data: Personal journeys and stories from the trenches of data analysis.
🔗 Dive Deeper & Connect
Let's forge stronger connections and foster a community of like-minded individuals passionate about data and life:
Email Updates: Subscribe for the latest posts and updates directly to your inbox.
Social Media Musings: Follow my journey and engage with me on:
LinkedIn: Tripathi Aditya Prakash
Twitter: Tripathi Aditya Prakash | Shivai
Instagram: Insights & Inspirations
Podcasts & Videos: Immerse yourself in the digital dialogue:
Spotify Podcasts: Shivai Data Revelations | That Data Guy
🌟 Be Part of the Dialogue
Your curiosity, questions, and engagement drive the essence of Data Dilemmas. Interact with our posts, share your insights, and join us in navigating the vast data cosmos. Your support ignites this exploration, allowing us to decode the world's data and life stories together. Let's embark on this adventure, unraveling the mysteries, one byte and one tale at a time. ✨